Plots#
It is possible to create three different types of plots with the PIA software. The plotting functions are independent of the remaining software and only rely on the output data. Only the function for the time series plot is included in the main.py script, the others have to be added individually.
Time series overview#
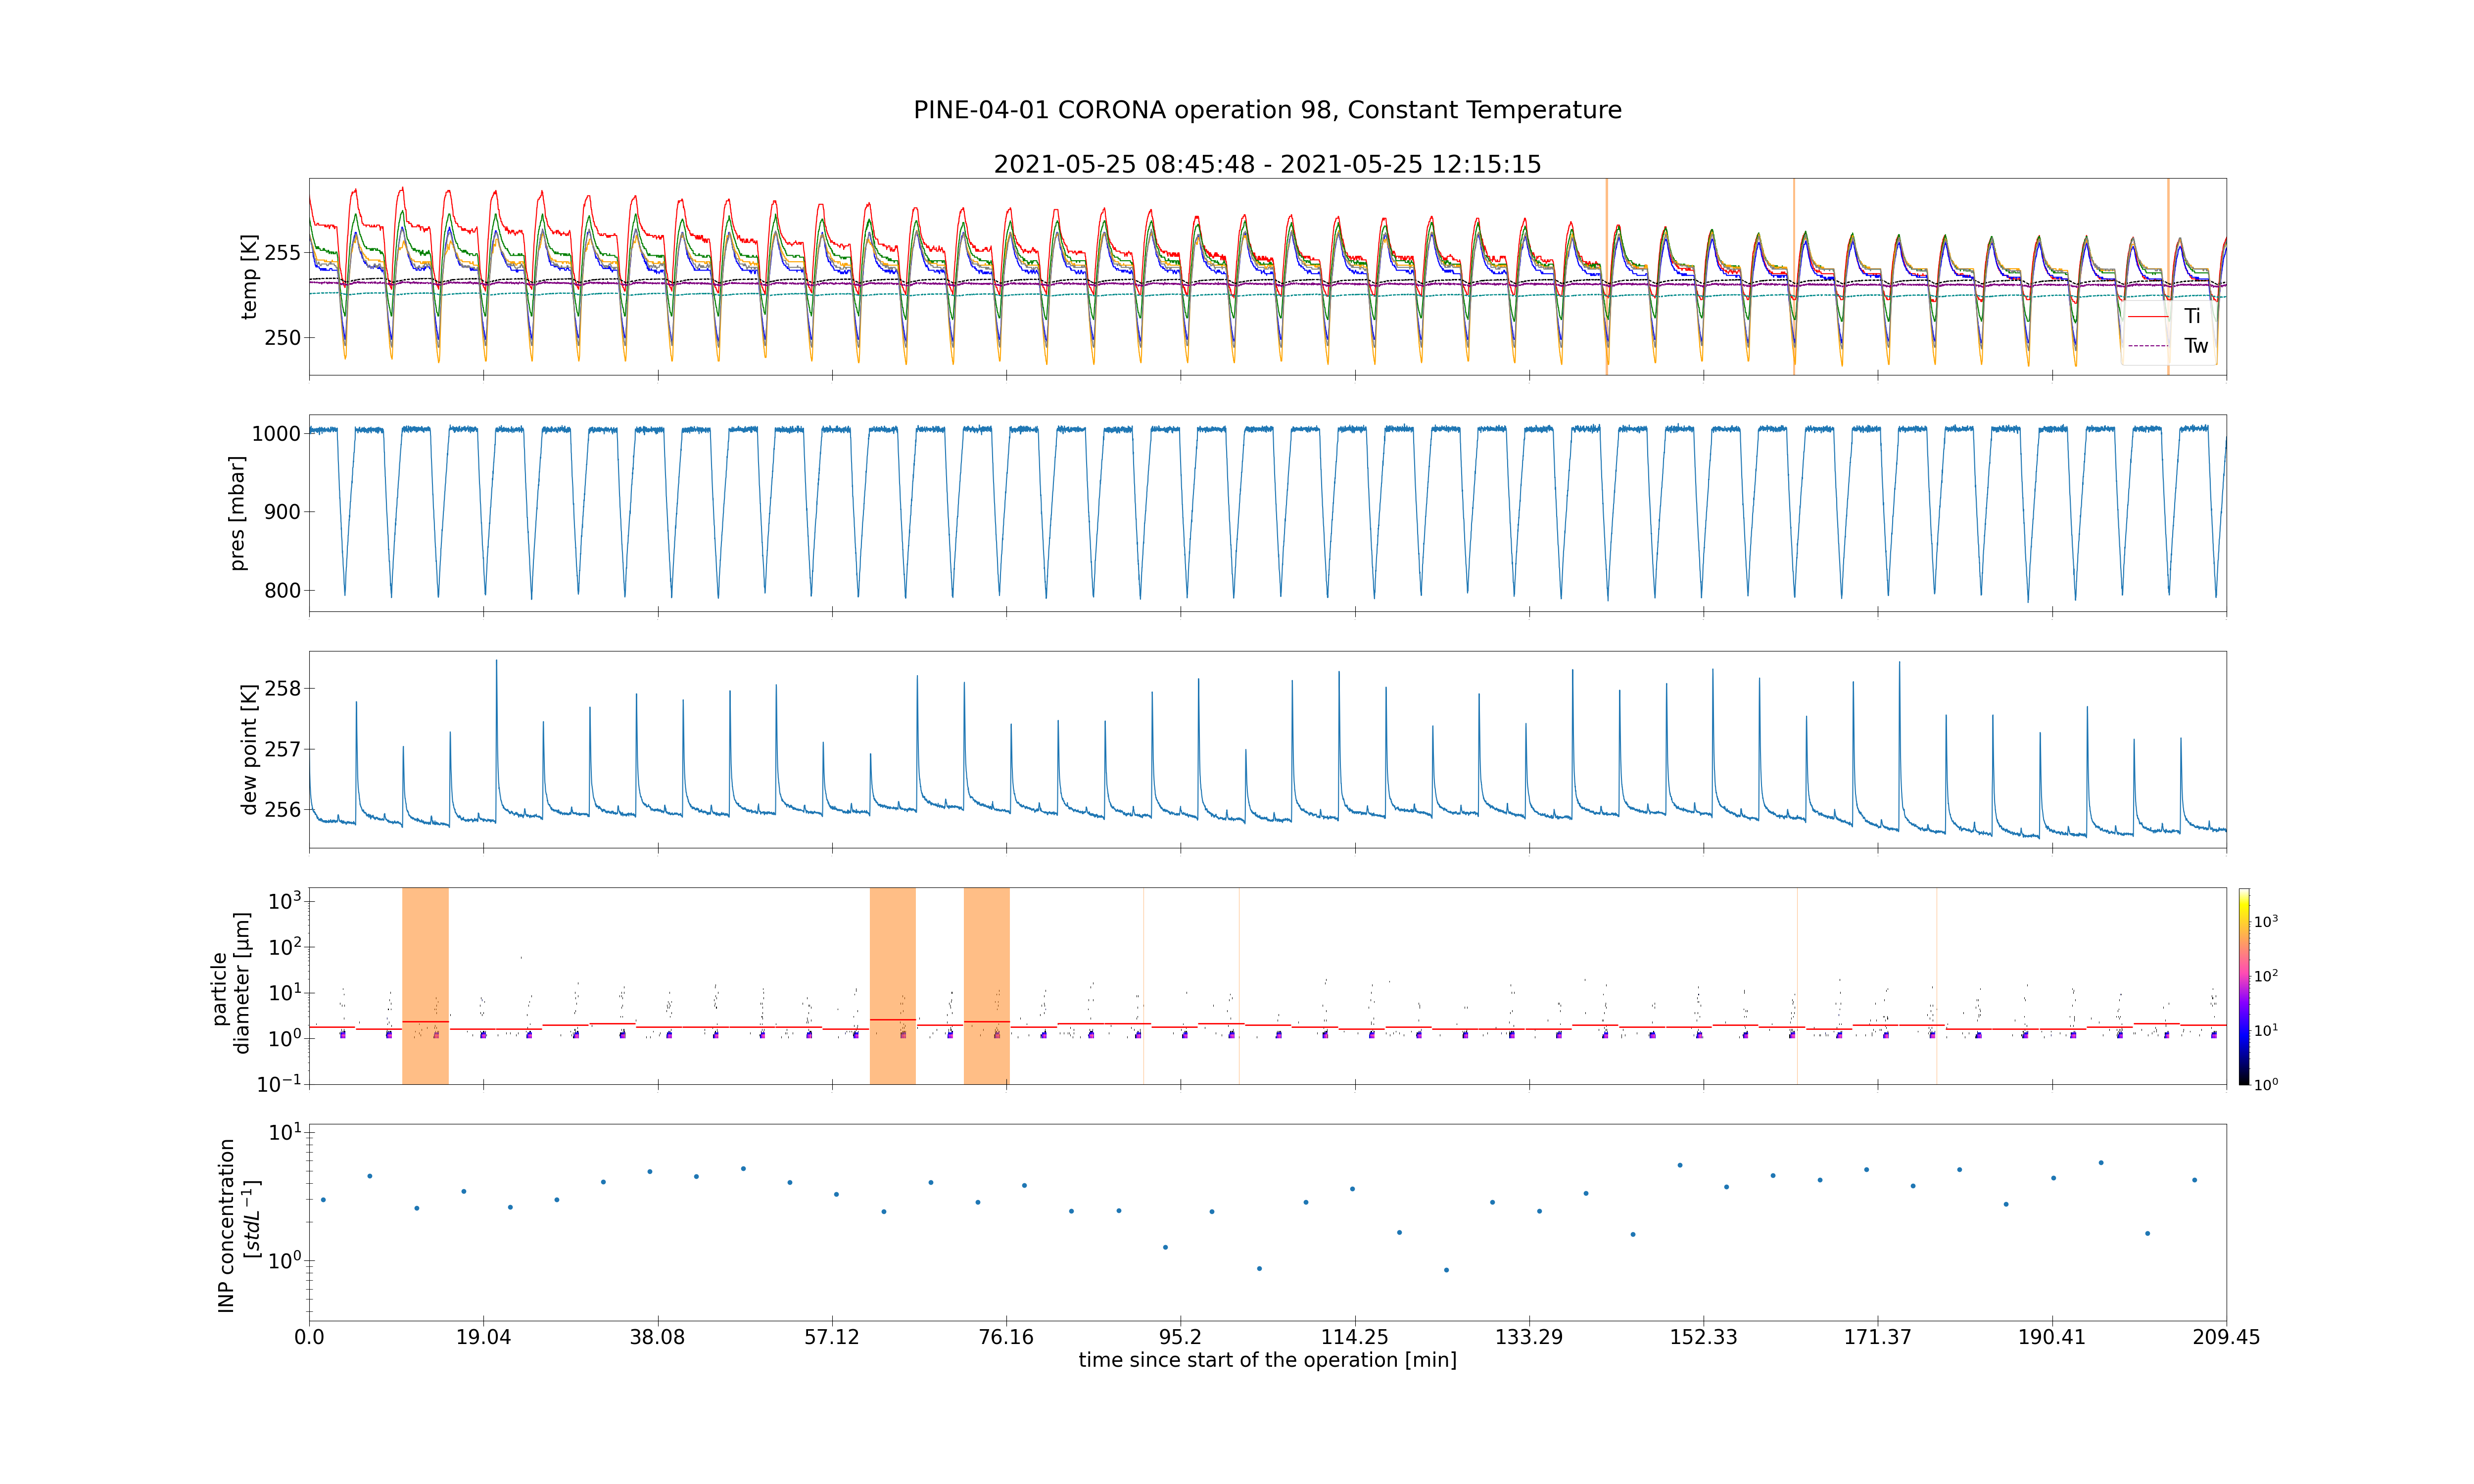
The overview plot shows the gas and wall temperatures, the pressure, the dew point temperature, the size distribution of the binned particles, and the INP concentration. Flagged data will be indicated with yellow, organge, or red coloured boxes. This plot is created for one operation. For operations taking longer than a few hours, details won’t be visible in the plot. It can be called via:
- pia.plotting.PlotsPINE(campaign, pine_id, operation_id, manual_ice_threshold)#
Creates time series for PINE
- Parameters:
campaign (str) – name of campaign
pine_id (str)
operation_id (int)
manual_ice_threshold (bool) – whether the ice threshold is manually set or not
- pia.plotting.PlotsPINE.plot_timeseries(self, cirrus_mode)#
Creates time series.
- Parameters:
cirrus_mode (bool) – whether the measurements were made in cirrus regime or not
Diagnostics Plot#
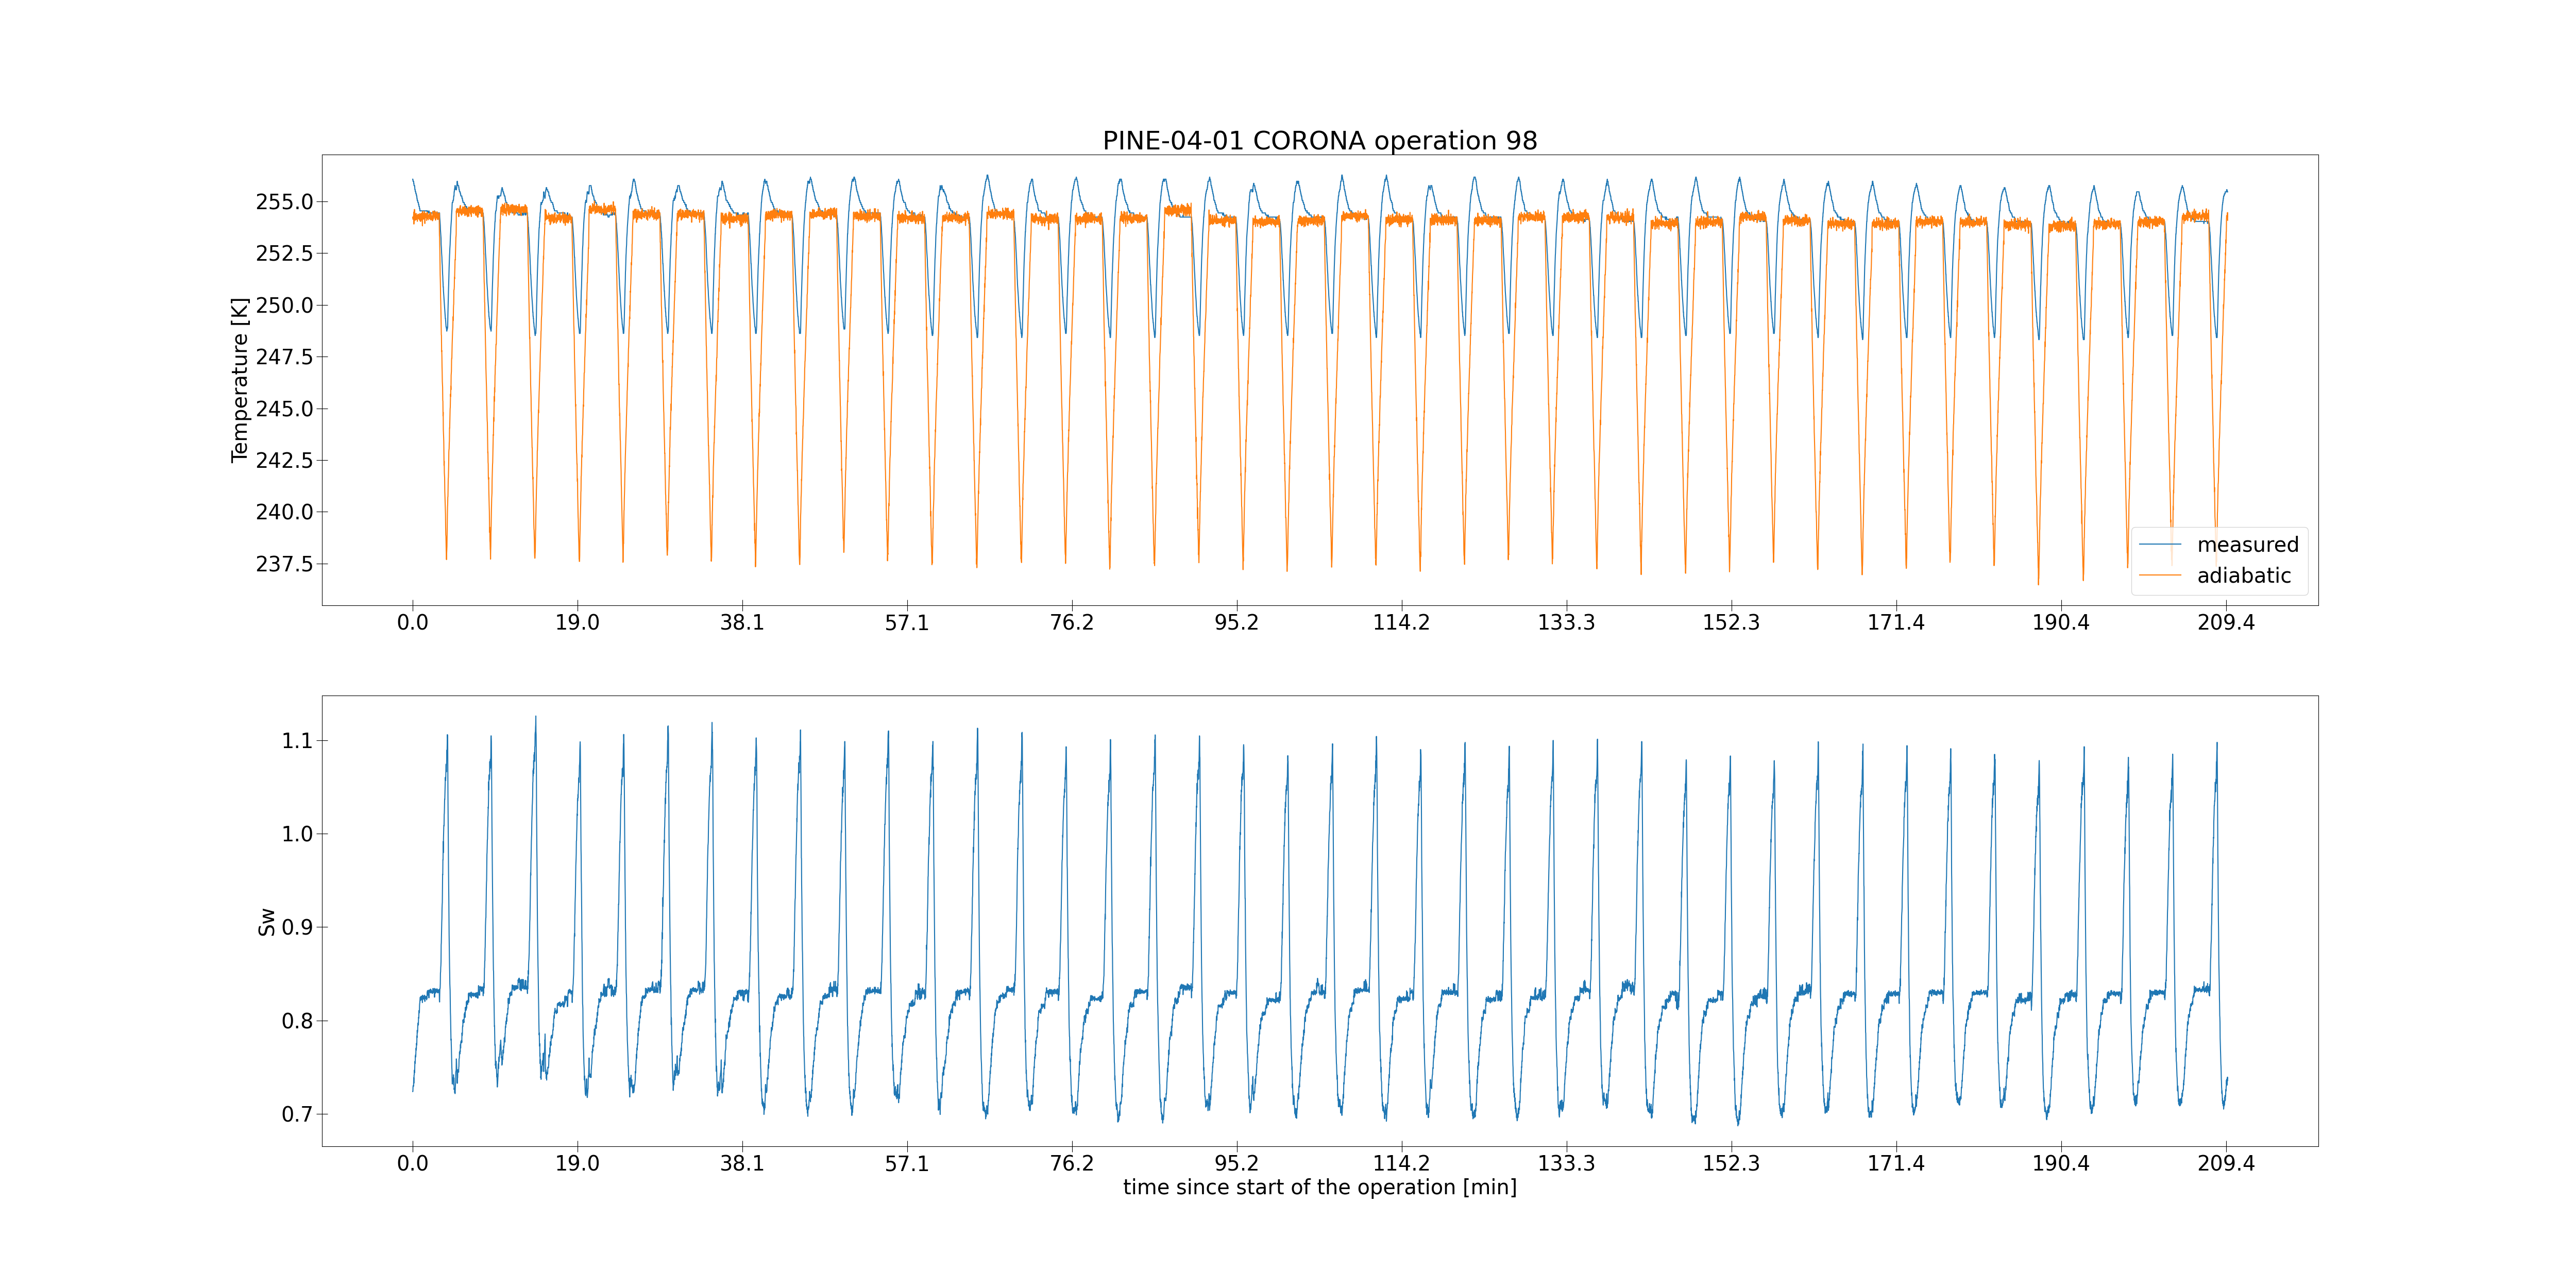
The diagnostics plot creates a comparison of the theoretical dry adiabatic temperatures and saturation ratio with the measured values for one operation. It can be called via:
- pia.plotting.PlotsPINE(campaign, pine_id, operation_id, manual_ice_threshold)#
Creates time series for PINE
- Parameters:
campaign (str) – name of campaign
pine_id (str)
operation_id (int)
manual_ice_threshold (bool) – whether the ice threshold is manually set or not
- pia.plotting.PlotsPINE.plot_diagnostic(self)#
Creates a timeseries plot for the adiabatic temperature and the saturation ratio
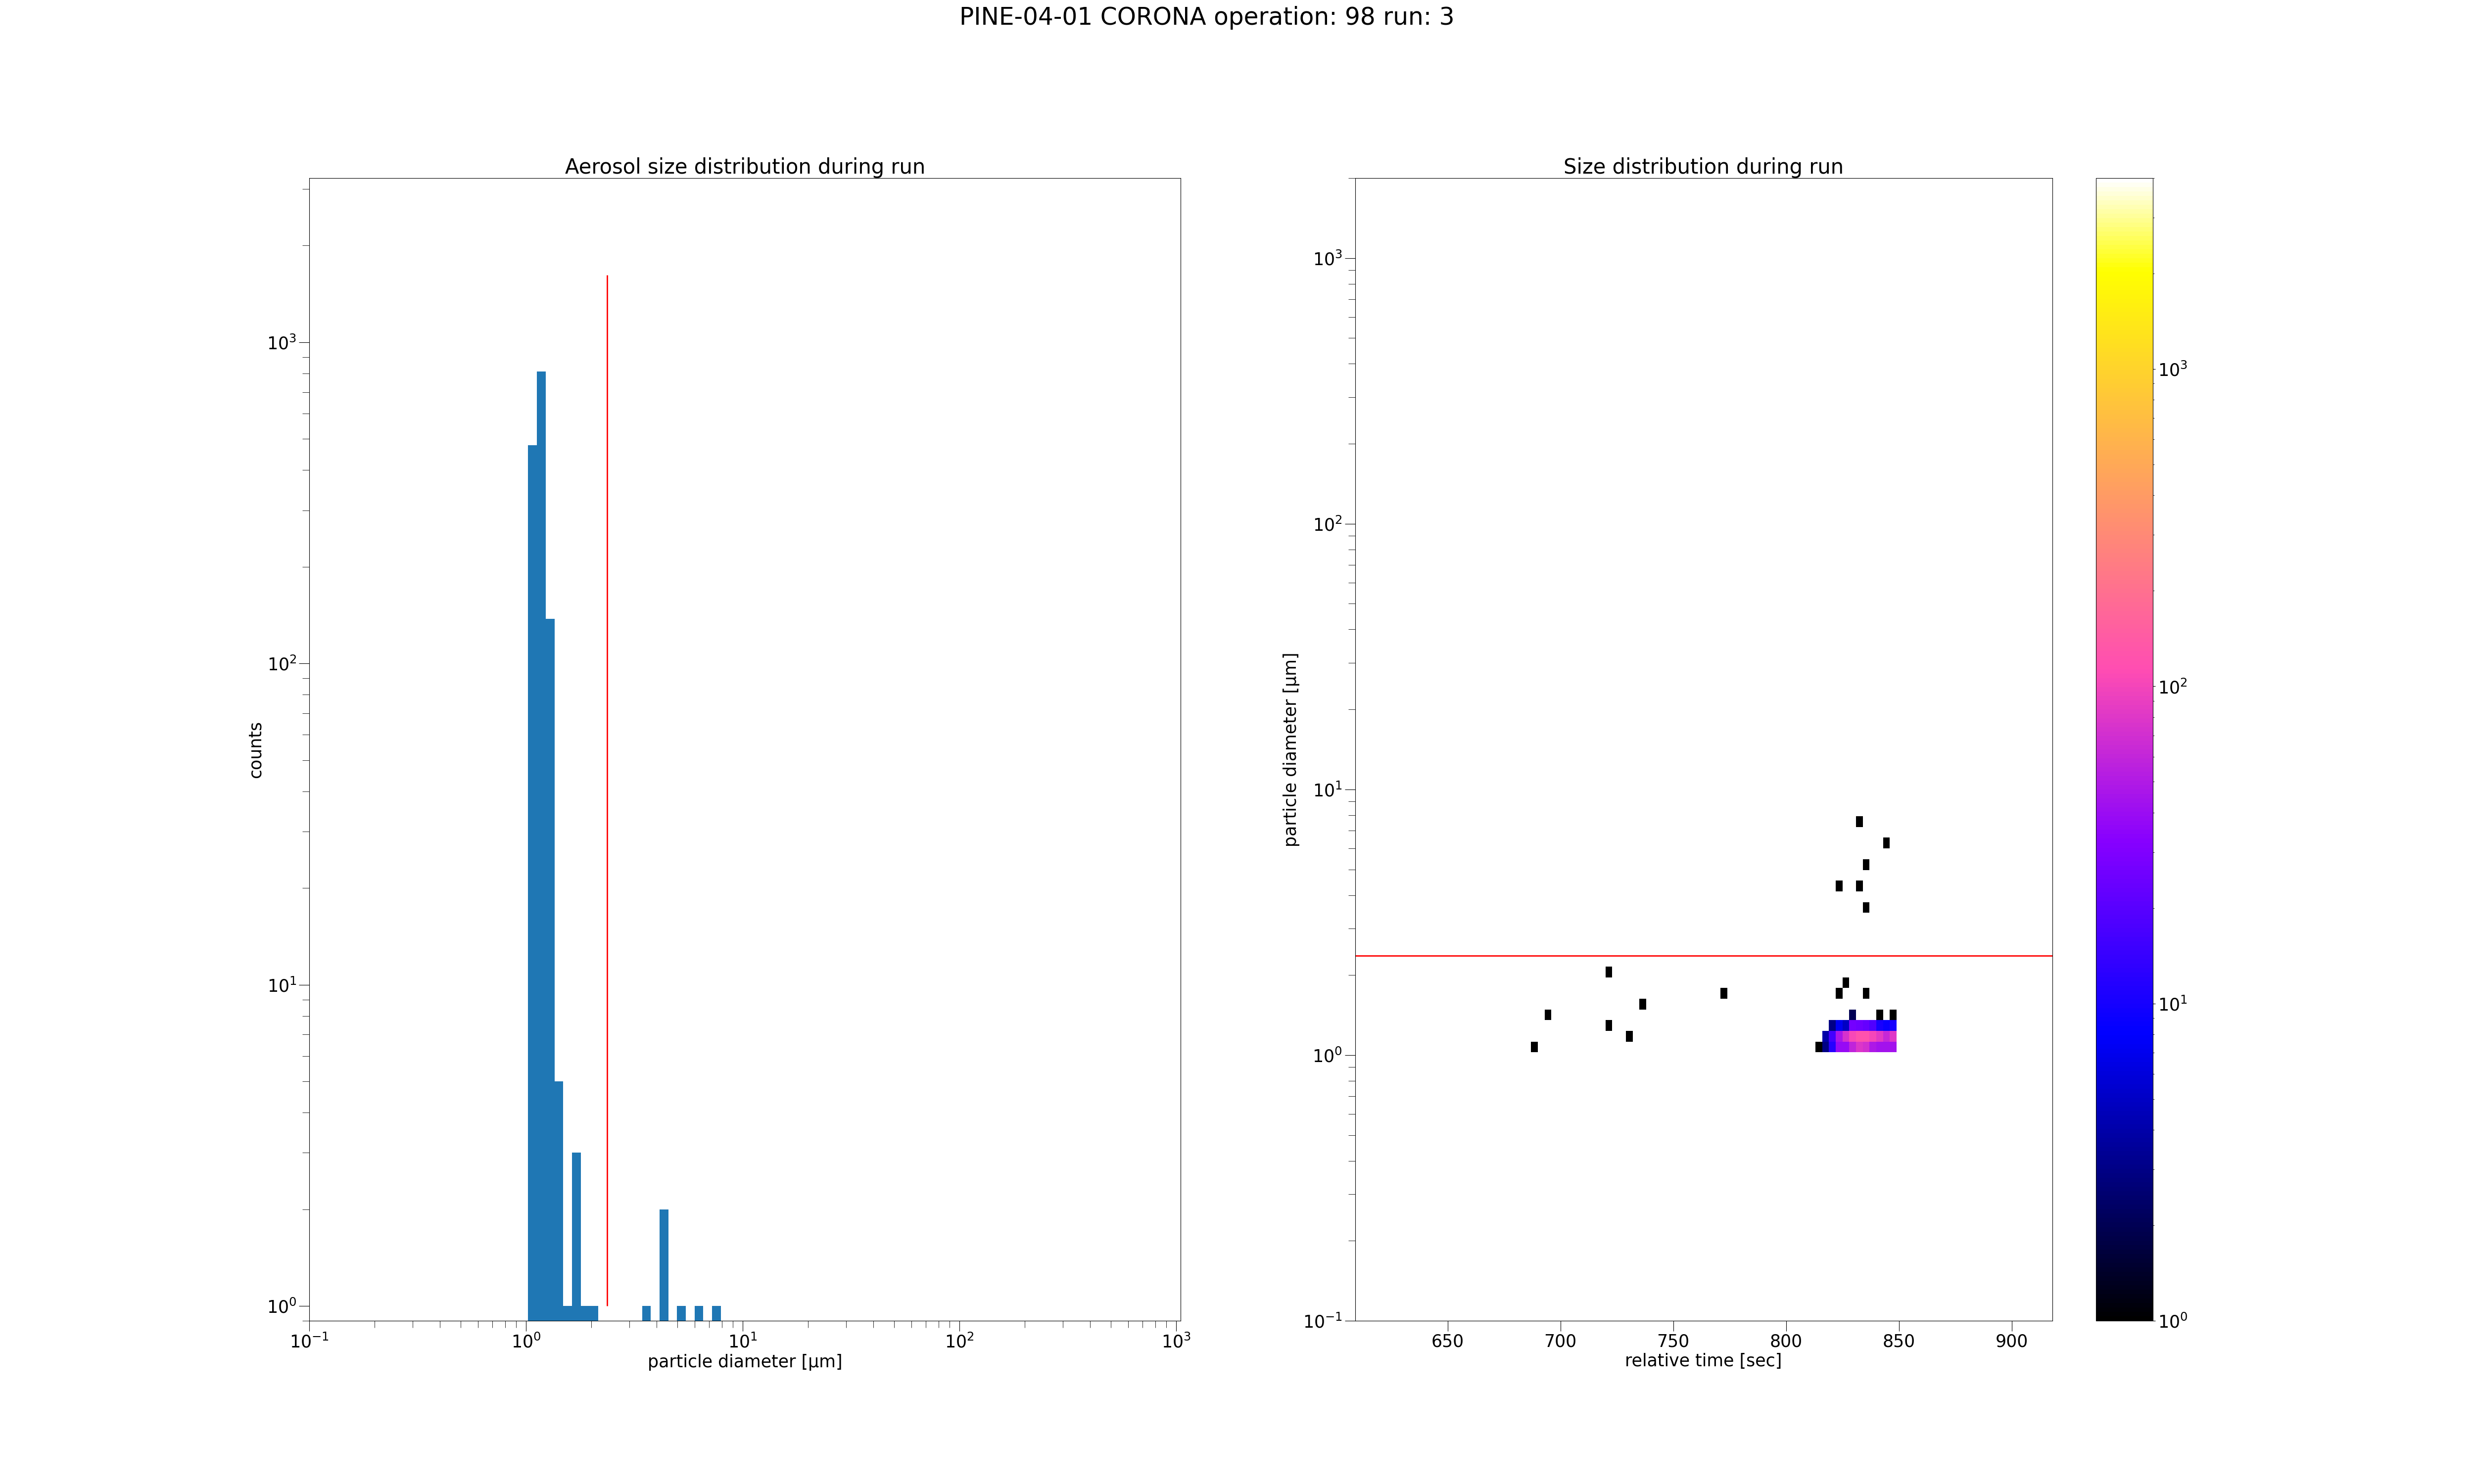
Histogram of single run#
For specified runs histograms of the size distribution including the ice threshold is plotted. It can be called via:
- pia.plotting.PlotsPINE(campaign, pine_id, operation_id, manual_ice_threshold)#
Creates time series for PINE
- Parameters:
campaign (str) – name of campaign
pine_id (str)
operation_id (int)
manual_ice_threshold (bool) – whether the ice threshold is manually set or not
- pia.plotting.PlotsPINE.plot_hist(self, runs)#
Creates histograms for single runs.
- Parameters:
runs (list) – list of runs, that should be plotted